New research corrects bias in data from fitness app
ASU research strategy eliminates issues with crowdsourced data in order to get an accurate picture of bicycle ridership

Recently, the culture is moving to change transportation habits for both health and environmental benefits. Many people have picked up the habit of riding a bicycle to get in their exercise and as a way to avoid the drudge of their morning commute. As more people decide to bike, questions remain: Who is deciding to bike instead of drive, and what influenced them to make that decision?
More and more public health and urban planning agencies are turning to crowdsourced data to help them better understand this population. This data can gather information about riders, help understand the built environment effect on ridership and promote safety. But, does crowdsourced data — while easier to obtain than traditional data on bicycle ridership — provide a clear picture of who is riding, where they are riding and what motivates them?
New research from Arizona State University's School of Geographical Sciences and Urban Planning not only exposes some of the bias found in the crowdsourced data, but also creates a model to correct that bias to have a better understanding of bicycle ridership in Phoenix.
According to their article “Correcting Bias in Crowdsourced Data to Map Bicycle Ridership of All Bicyclists,” published earlier this month in Urban Science, the researchers state that the popularity of fitness apps has emerged as one of the most popular and rich sources of data for physical activity tracking.
“It is really hard to count how many people use bicycles and the lack of data makes it hard to plan streets that are safe and encouraging for bicycling,” explained Trisalyn Nelson, director of the School of Geographical Sciences and Urban Planning and co-author of the article.
“... The trouble is that the only people that are mapped by [fitness apps] are fitness riders. It is biased data. We have developed a model that integrates [app] data and counts official bicyclists to make maps of all bicyclists.”
Traditionally, collecting data on bicycle ridership required manual collection. But this new model provides the opportunity to use the easier to collect crowdsourced data by correcting the biases to make it more representative of what is actually happening on the city streets.
“This model is a generalized approach to modeling bicycle ridership volume in a city. Transportation authorities, urban planners and policymakers can directly benefit from this model,” said Avipsa Roy, a PhD student in the School of Geographical Sciences and Urban Planning and lead author of the article.
“The map derived using the model can also be used to visually detect clusters of bicyclist volumes in a region of interest, thereby improving coverage for manual data collection efforts by transportation authorities. This could increase the amount of ground truth for validation of our model, and help to suggest potential street intersections where more bike counters should be placed for better data collection and improve coverage in terms of spatial resolution.”
Once they were able to correct for the bias in the data, some interesting trends became more evident, including what physical features of an area create a higher population of bicycle ridership.
“The most significant factor that influenced bicycle ridership was proximity to green spaces and residential areas,” Roy said.
The green spaces provide a refuge during the hot months of the summer and the ridership in residential areas is an indication of riders wanting access to lower speed limits, lower traffic volume and safer ride experience. These insights can help tremendously in creating spaces that will encourage more ridership.
“Planners and decisions makers will benefit from having better data for decision-making and we hope that this leads to decisions that benefit all street users: drivers, transit users, bicyclists and pedestrians,” Nelson said.
Beyond bicycle ridership, this research highlights the growing need to correct bias in big data. As more data becomes available, the more people will want to utilize it in the decision-making process, but Nelson warns them to utilize caution.
“There is a lot of interest in big data, but a lot of big data are collected using ad hoc or opportunistic sampling methods, most of which are biased," Nelson said. "Methods for reducing bias in data are critical to ensure decisions made with big data are valid and not having unintended negative consequences.”
Top photo: School of Sustainability students and staff bike to work near Old Main on ASU's Tempe campus. Photo by Deanna Dent/ASU Now
More Health and medicine
College of Health Solutions hosts visit from leading expert in genomic research
Some fortunate Arizona State University faculty, staff and students were able to gain valuable insights and perspective during a visit by one of the country’s leading figures in health and scientific…
Indigenous ASU research team recommends assistance for tribal members still reeling from COVID-19’s effects
When Matt Ignacio’s tribe, the Tohono O’odham Nation, donated $1 million to Arizona State University to support COVID-19 research, he applied for some of the money to understand and report any…
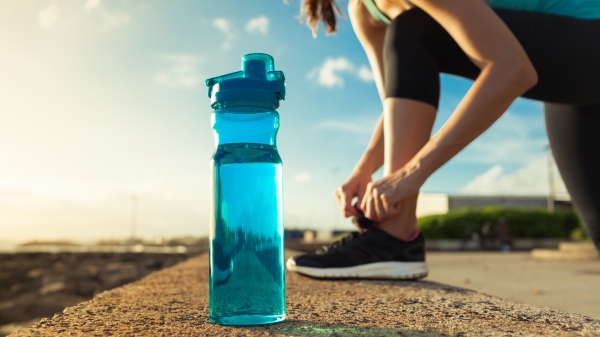
Tips for staying hydrated during Pat's Run and other outdoor activities
By Aidan Hansen Staying hydrated and listening to your body during outdoor exercise activities is crucial to one's health and safety, especially in warm climates. And with the average daytime high…