Illustrating the dance of the Earth
ASU professor creates climate data visualization tool that can reveal changes in the atmosphere in real time
Moist air rises from the Amazon river basin, colliding with Saharan dust blown over the Atlantic. Temperatures rise in the ocean around the Azores. Winds circle faster and faster, whipping the sea into a frenzy of cresting swells. Chunks of ice the size of buildings calve off Greenland. Aroused by storms in the Gulf of California, dust storms stomp across the Sonoran desert, tumbling birds through the sky.
The Earth’s systems dance ceaselessly. Wenwen Li has captured the waltz in a new tool for climate visualization.
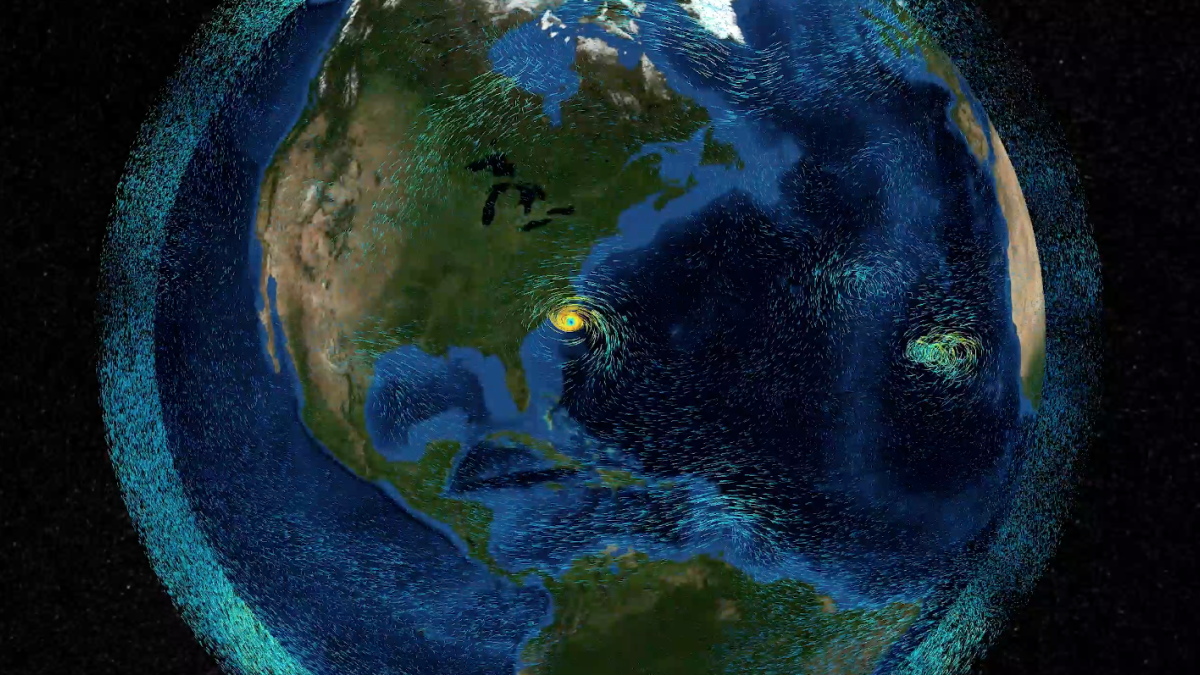
PolarGlobe is a web-scale scientific visualization tool to support ready access and interactive analysis of multi-dimensional climate data. It’s capable of illustrating changes in the atmosphere vividly in real time.
Designed specifically for polar scientists seeking to understand the ice caps, the tool is also useful for high school science teachers and weather fanatics.
“It’s not just for research. Every day, weather watchers can see what’s going on,” said Li, an associate professor in the School of Geographical Sciences and Urban Planning at Arizona State University. “We would love to inspire the next generation into science.”

Associate Professor WenWen Li poses for a portrait at the Lattie Coor building on the Tempe campus. Li's current project for the National Science Foundation, PolarGlobe, is a large-scale web crawling system that visually illustrates geospatial data. Photo by Deanna Dent/ASU Now
Climate data in itself is simply massive. There’s data pouring in every day from weather stations, remote sensors, balloons, planes and observers. There’s air temperature, air pressure, ocean temperatures and wind data. Both atmosphere and ocean interact with terrain, creating more data.
“Climate data is multidimensional,” Li said. “It’s not just covering the earth’s surface. It also extends to space ... There is a huge amount of data about the earth being generated every moment. Traditionally when climate scientists analyze the data, they have to have dedicated software installed on their own computer and they have to do a layer base analysis.”
Analysis with partial data doesn’t give the full scope of what is a very big picture.
“If we just visualize a single piece of data, over a single dimension, in software, the amount of information we can see is very limited,” Li said. “The entire volume of data can be visualized on this virtual globe-based scientific visualization tool. The benefit of this is that it can be seen in action.”
Li calls the technology m-cubed: “Multi-dimensional, multi-faceted, multi-variate.”
Historical data in the tool goes back to 2010. Current data is updated every six hours. The tool uses artificial intelligence and machine learning so it continues to learn on its own as new data is generated.
“We gather this data in real time, process it, and digest it into our visualization system and host it by providing a very user-friendly interface which is web-based, so anyone with a browser can get onto the tool and analyze a lot of the atmospheric phenomenon,” Li said.
It’s a huge amount of data: 350 terabytes — the equivalent of 70 years of letters delivered by the U.S. Postal Service.
A geographic information scientist, Li was trained in both computer science and earth systems science. “I’m very interested in bridging the two fields,” she said.
PhD student Sizhe Wang who obtained a MS in GIScience and is seeking a PhD in computer science developed the prototype of PolarGlobe.
WenWen Li, associate professor in ASU's School of Geographical Sciences and Urban Planning, has developed a tool that allows climate data to be represented in a 4D visual model. The model illustrates interactions between Earth systems and was funded by the National Science Foundation. The above video shows a virtual demonstration of the tool. Video courtesy of WenWen Li
More Science and technology

Celebrating 34 years of space discovery with NASA
This year, NASA's Hubble Space Telescope (HST) is celebrating its 34th anniversary of the world's first space-based optical telescope, which paved the scientific pathway for NASA's James Webb Space…

Making magic happen: Engineering and designing theme parks
The themed entertainment industry is widespread and diverse, encompassing everything from theme parks to aquariums, zoos, water parks, museums and more. The Theme Park Engineering and Design…
AI-equipped feeders allow ASU Online students to study bird behavior remotely
ASU Online students are participating in a research opportunity that's for the birds — literally. Online Bird Buddies is a project that allows students to observe birds remotely, using bird feeders…