The future of rain: Predicting the extremes
ASU researcher models present rainfall data to improve future forecasts of how extreme weather will affect urban living
The weather-related effects of climate change will affect the next phase of urban living. We just need to know how and when.
In 2017, calamitous weather seemed ever present. Three hurricanes brought record rain, intense flooding and widespread damage to Texas, Florida, Puerto Rico and the U.S. Virgin Islands. California floods led to the Oroville Dam crisis, where the main and emergency spillways eroded and resulted in extensive evacuations. Heavy rains led to a deadly flash flood that tore through a canyon near Payson, Arizona, killing 10.
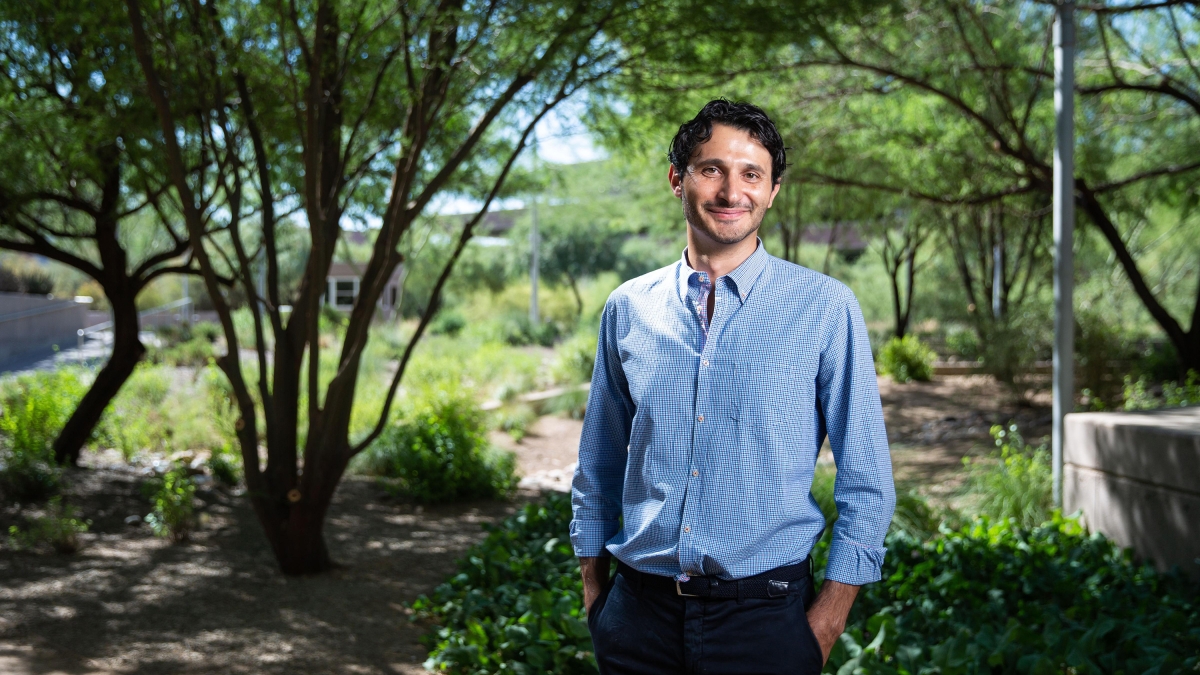
Extreme weather, including heavy rainfall, drought and excessive heat, now threatens urban centers on an unprecedented scale. That’s why Giuseppe Mascaro, an assistant professor of civil engineering at Arizona State University, sought to characterize daily rainfall in the Phoenix metropolitan area and throughout central Arizona using statistical models. His results are published in the Journal of Hydrology.
“Why do we want to characterize extremes?” asked Mascaro, a faculty member in the School of Sustainable Engineering and the Built Environment — one of the six schools in the Ira A. Fulton Schools of Engineering. “The recent occurrence of natural disasters triggered by heavy rainfall and the perception that this has been happening more frequently than usual require conducting this type of quantitative analysis to understand the current situation, compare it with the past and try to model the future.”
Statistical models of extreme rainfall are crucial to support water, engineering and climate studies. Mascaro’s models will inform efforts in flood prediction, water management and urban infrastructure design. Additionally, Mascaro’s models will evaluate the ability of current climate models to reliably forecast heavy rainfall scenarios.
Video by Deanna Dent/ASU Now
Methodology reduces uncertainty
Extremes are rare by definition. A 100-year storm theoretically happens once every 100 years. This makes observing extreme weather events challenging, especially in the Southwestern United States where records of rainfall observations can be sparser and shorter as compared with the Eastern part of the country.
For instance, the National Oceanic and Atmospheric Administration created Atlas 14, a precipitation atlas that characterizes the frequency and intensity of rainfall in the Southwestern U.S. In Arizona, the atlas is based on data from a network of just 270 rain gauges across the entire state.
Civil engineers rely on statistical models to design infrastructure and stormwater systems for urban centers, assuming that the climate variability observed in the past will remain the same in the future. However, theoretical arguments suggest that a warmer climate can lead to increased frequency and magnitude of extreme weather-related events, implying that the existing infrastructure may not be able to mitigate the effects of heavy rainfall and flooding.
“The drawback of sparse and shorter records for statistical analyses is that the probability distributions are not robust enough,” said Mascaro, who is also a research engineer in ASU’s Julie Ann Wrigley Global Institute of Sustainability and an assistant professor in the Urban Climate Research Center. “There is uncertainty. I want to reduce uncertainty in the estimation of extremes so we can plan for the future better.”
To characterize daily rainfall extremes in the Phoenix metropolitan area and central Arizona, Mascaro utilized an untapped data set from the Flood Control District of Maricopa County. The network includes records from 310 rain gauges, of which 240 have more than 15 years of data.
Mascaro analyzed this “treasure” of data using an alternative statistical approach called peak-over-threshold analysis, which expands the amount of data used to characterize extreme events.
“People in my field say, ‘OK, this method is not new,’” Mascaro said. “But then I applied recent methodological advancements that have been developed using global long-term rainfall records to help correct errors in the frequency analysis of shorter datasets. This improves the robustness while limiting the effect of small sample sizes.”
Empirical results useful in forecasting the future
Mascaro conducted analyses of heavy rainfall in the Phoenix metropolitan area and central Arizona, annually and seasonally. For the seasonal analysis, Mascaro accounted for Arizona’s summer monsoon marked July through September and the winter season marked November to March. He estimated the parameters of a statistical distribution, called the Generalized Pareto distribution, to reproduce the frequency of daily extreme rainfall.
Through this analysis, Mascaro found that the statistical behavior of extreme rainfall in summer differs from that in winter. In summer, storms are very localized and short, while they are generally longer and widespread in winter due to cold fronts from the Pacific Ocean.
Mascaro also found the intensity of wintertime daily rainfall extremes increases with elevation. However, there are no organized patterns of rainfall extremes based on latitude, longitude or elevation for summertime extremes. This type of information helps refine statistical models that estimate rainfall frequency across Phoenix and Central Arizona.
The results of Mascaro’s work on daily rainfall extremes inform the design of civil infrastructure and provide tools to evaluate the ability of climate models to predict extreme events. These methodologies are broadly applicable to other regions, including urban areas where rainfall records are becoming increasingly available due to growing networks of rain gauges.
Mascaro’s rainfall prediction models will be a vital component to promote urban resilience and water sustainability as urban centers face unprecedented weather-related challenges with a warming climate.
In addition to informing the climate sciences, Mascaro’s results will have far-reaching impacts for research networks currently active at ASU, such as the Urban Resilience to Extremes Sustainability Research Network and the Decision Center for a Desert City.
UREx SRN promotes the transition from contemporary urban areas to cities of the future. These cities will have flexible, adaptable, socially equitable and ecologically based infrastructure that remains resilient even through an increased occurrence of extreme weather events. The researchers of UREx SRN analyze extremes in urban areas to figure out how to update design standards for the infrastructure of the future. Mascaro’s research can help analyze the uncertainty of current statistical models used to design and operate infrastructure.
A change in the rainfall patterns, including extremes, will also have an impact on the region’s water resources. Thus, DCDC can use Mascaro’s rainfall models to help advance knowledge about decision making with uncertainty in the context of water sustainability and urban climate-change adaptation.
“If we trust the ability of climate models to reproduce large-scale weather patterns that cause extreme rainfall, we can quantify how the frequency of these patterns will change in future greenhouse gas emission scenarios,” Mascaro said. “We can combine this information with the statistical analyses on rainfall extremes observed by the gauges to obtain a more realistic prediction of the future rainfall distribution at local scales.”
Top photo: Assistant Professor Giuseppe Mascaro's research focuses on statistical analysis of rain gauge data collected by the Flood Control District of Maricopa County to better forecast extreme weather and build better infrastructure. Photo by Deanna Dent/ASU Now
More Science and technology

Advanced packaging the next big thing in semiconductors — and no, we're not talking about boxes
Microchips are hot. The tiny bits of silicon are integral to 21st-century life because they power the smartphones we rely on, the cars we drive and the advanced weaponry that is the backbone of…
Securing the wireless spectrum
The number of devices using wireless communications networks for telephone calls, texting, data and more has grown from 336 million in 2013 to 523 million in 2022, according to data from U.S.…

New interactive game educates children on heat safety
Ask A Biologist, a long-running K–12 educational outreach effort by the School of Life Sciences at Arizona State University, has launched its latest interactive educational game, called "Beat the…